Construction & Engineering · Updated October 6, 2026
How do you measure construction drawings digitally?
Reviewed for technical accuracy by licensed professional engineers.
Short answer
Digital construction drawing measurement means calibrating a PDF sheet to its real-world scale and then measuring lengths, areas, perimeters, volumes, and counts directly on the drawing with snap-to-linework precision. In PDFDepth you calibrate once per sheet, measure with snapping to vector geometry, review the per-page measurement list, sync a scale across the whole plan set, and export everything to Excel.
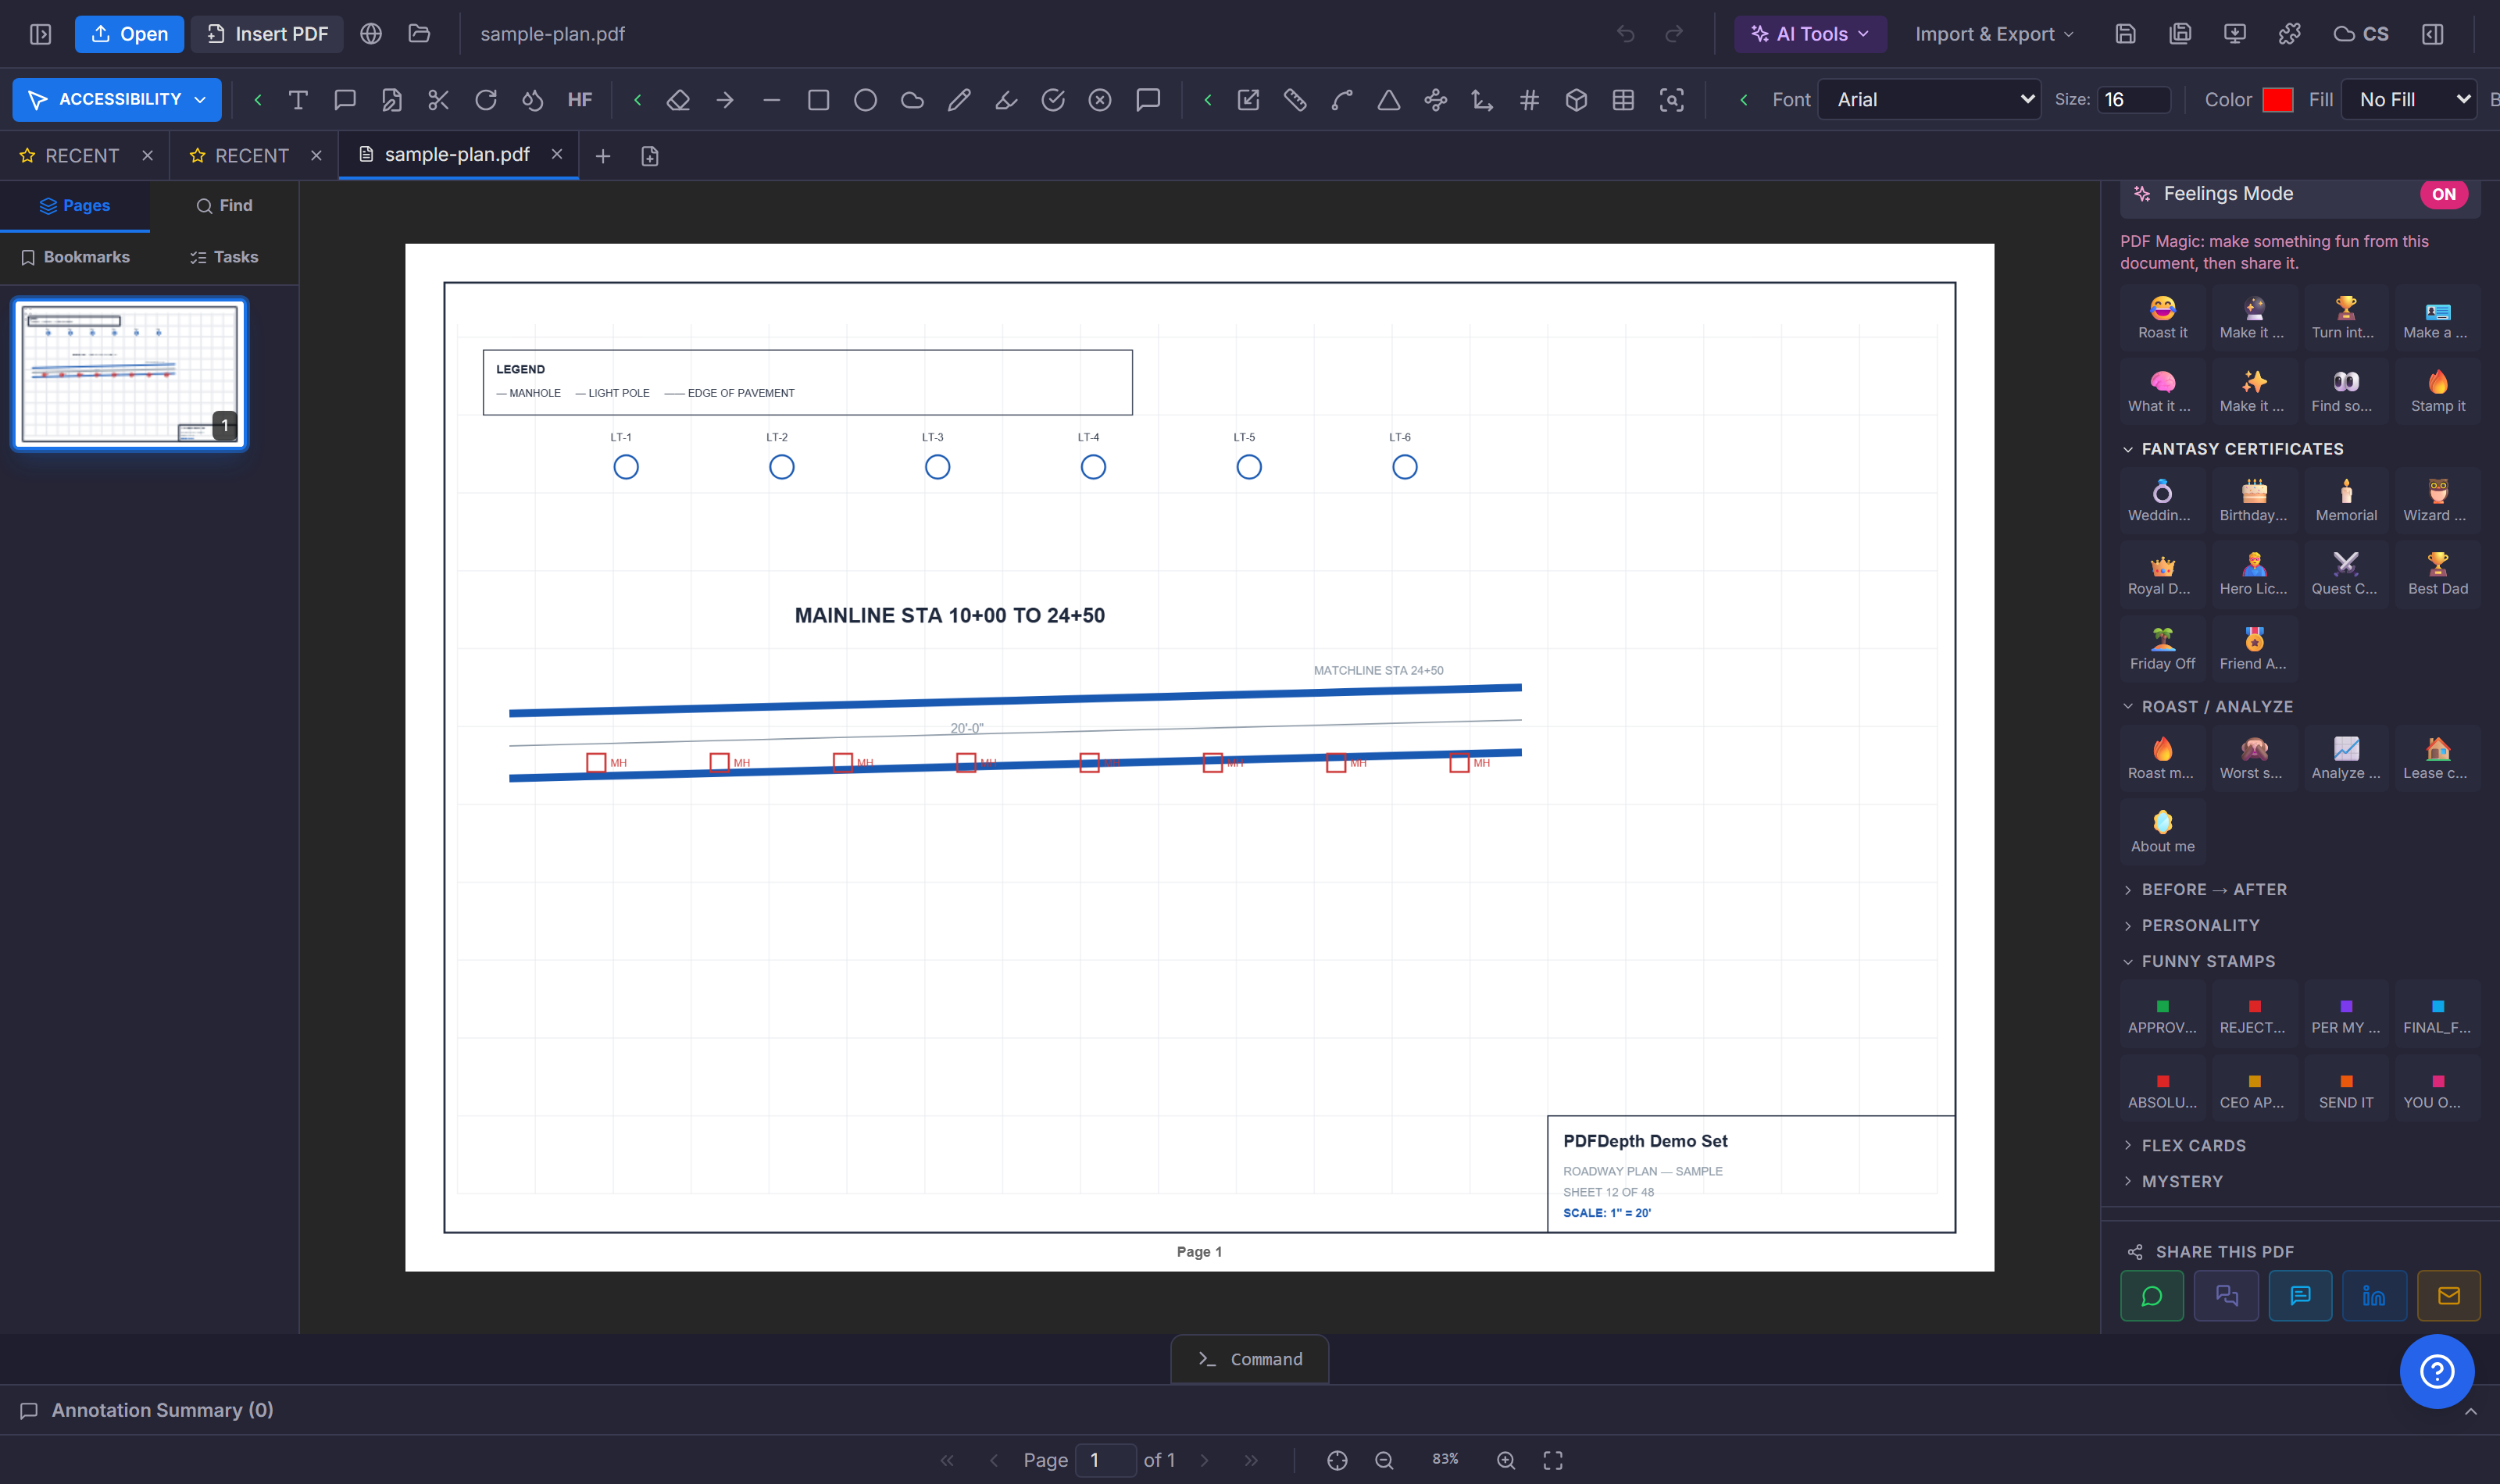
Calibration is the whole game
A digital measurement is only as good as the scale behind it. If the sheet is calibrated to 1/4" = 1'-0" but the real scale is 1/8", every length is off by a factor of two — silently, and into the bid. PDFDepth treats calibration as a first-class page property: set it once, verify it against a known dimension, and recalibrate if the sheet disagrees. The scale-sync tool applies the same calibrated scale across every sheet in a plan set at once.
Snap to the drawing, not to pixels
Measuring on a scanned or vector PDF is only precise if the cursor snaps to the actual linework — walls, edges, centerlines — instead of to arbitrary pixels. PDFDepth snaps to vector geometry on vector sheets, and the smart-trace tool straightens rough traces against the underlying lines. On a sheet with mixed scales (a detail at 1" = 1'-0" next to a plan at 1/4"), each measured region carries its own calibrated view, so the 1" detail does not inherit the 1/4" scale.
What you can measure
Distance and polyline for runs. Area for surfaces. Perimeter for edges and trims. Volume by applying a depth to a measured area. Count for repeated symbols and fixtures. For engineering sheets, the section-properties tool goes further: centroid, moments of inertia (Ix, Iy), polar moment J, and radii of gyration on an enclosed region — the values a detail check or a connection design actually needs.
Verification and export
Every measurement lands in a per-page list you can filter, sort, and audit — so a wrong entry shows up before it hits the estimate. Sync the scale across the set, then export the whole takeoff to Excel with type, label, quantity, unit, and sheet per row. For a folder of sheets, the Master Takeoff Report aggregates quantities across the entire set.
References
Everything in this article runs in the live PDFDepth workspace — the same app the workflows above were verified against.
Key takeaways
- Calibrate first, verify against a known dimension, recalibrate if it disagrees.
- Snap to vector linework, not to pixels — smart-trace straightens rough paths.
- Mixed scales on one sheet are handled by per-view calibration.
- Section properties (centroid, Ix/Iy, J, gyration) are available on enclosed regions.
Related questions
As accurate as the calibration and the snapping. On a vector sheet with correct calibration, the measurement is precise to the drawn geometry. On a raster scan, accuracy depends on scan quality — which is why the smart-trace and snapping tools matter.
Do it in PDFDepth
In the app: Left panel → Tools → Measure; Calibration panel
Try it free — no signup, no upload
Related articles
Put it into practice
Everything above runs inside the PDFDepth workspace — free for 14 days, no credit card.
Start for Free